In part one of this blog from January 2024, I wrote about why I think Microsoft Power BI is a superior data analysis and reporting platform for MEDITECH Data Repository compared to SQL Server Reporting Services. In this second part of a a two-part analysis, I continue the discussion by reviewing the user presentation and interactivity experience.
Why Power BI is the best reporting platform for DR #1

The user experience
Initially both SSRS and Power BI are similar in that they’re both browser-based report viewers. While the familiar SSRS web portal is almost always hosted by an on-premises web server, the Power BI service is cloud-first and hosted by Microsoft with your organization’s M365 account. (Power BI Report Server, a combined on-premises report host is available at a significant license cost, but we haven’t seen this in practice at any MEDITECH hospitals.) The report home page for both is similar in that you’re presented with folders (SSRS) or workspaces (Power BI) that contain reports, and by selecting them you can see the list of available reports. From there, select a report to see it.
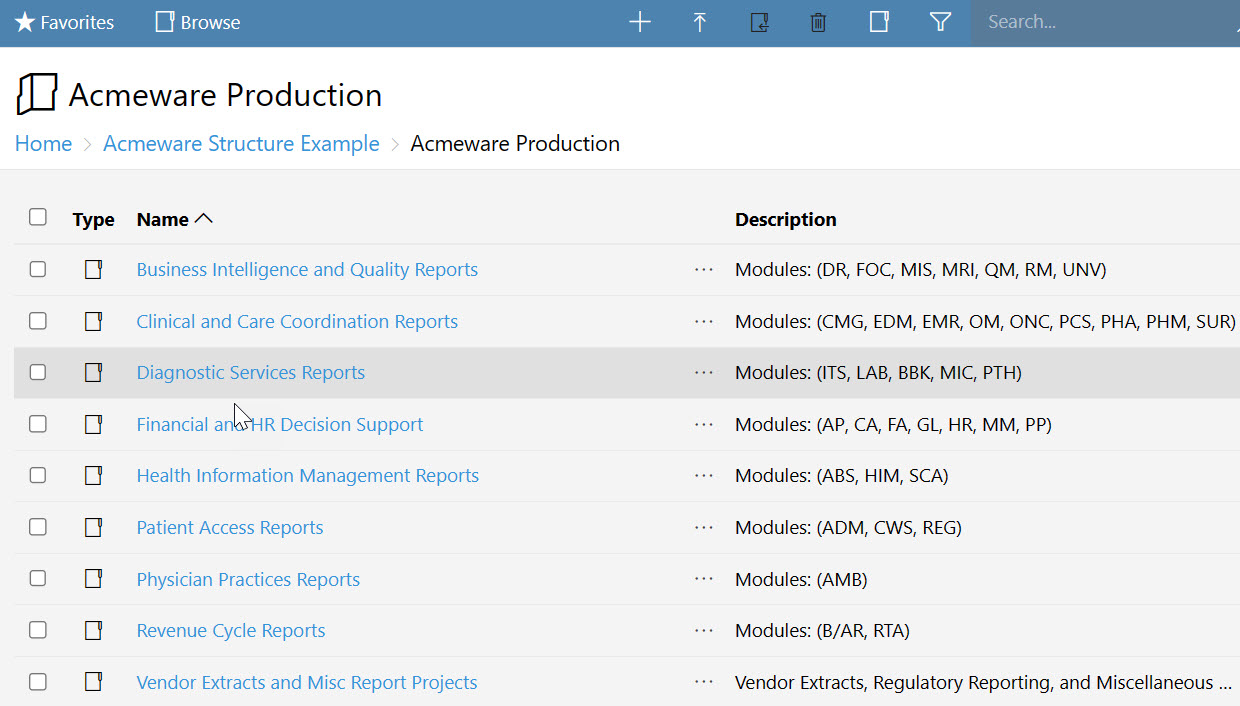
SSRS web portal
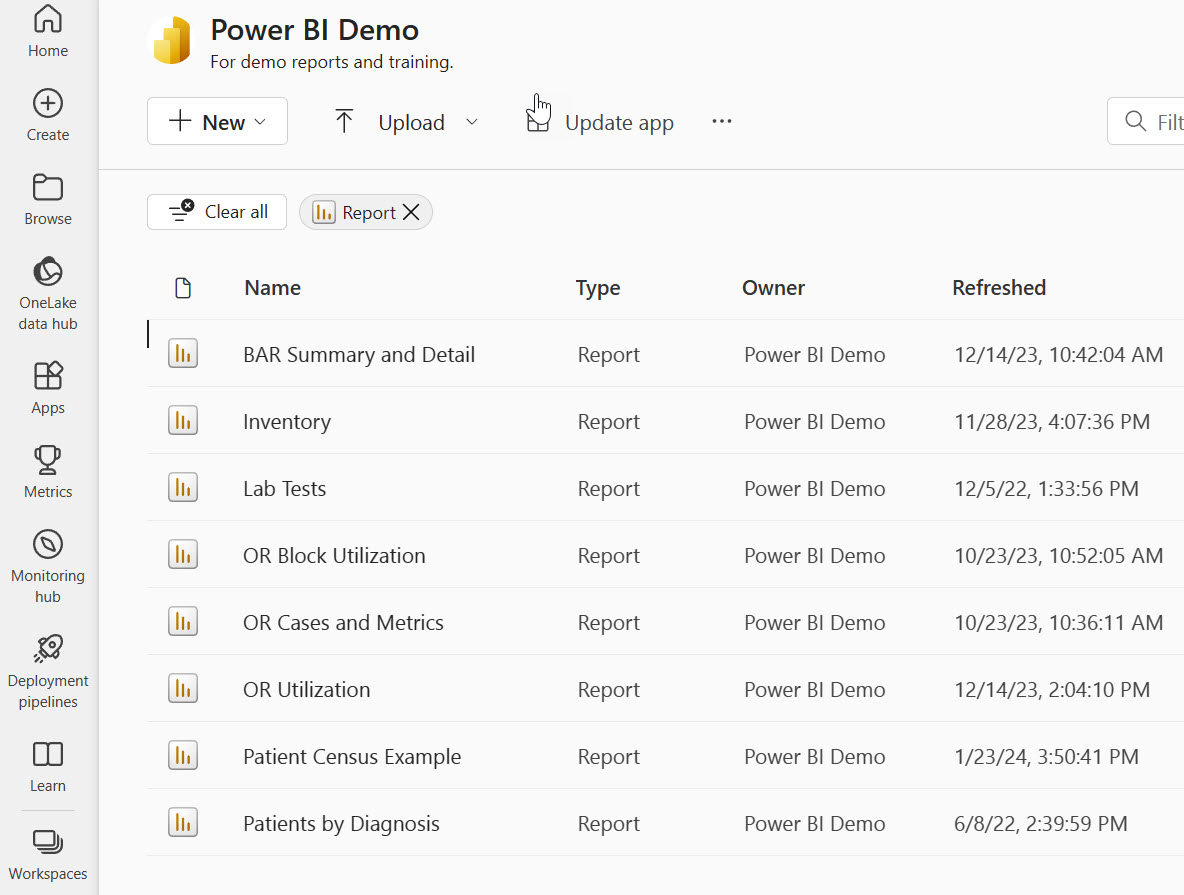
Power BI workspace
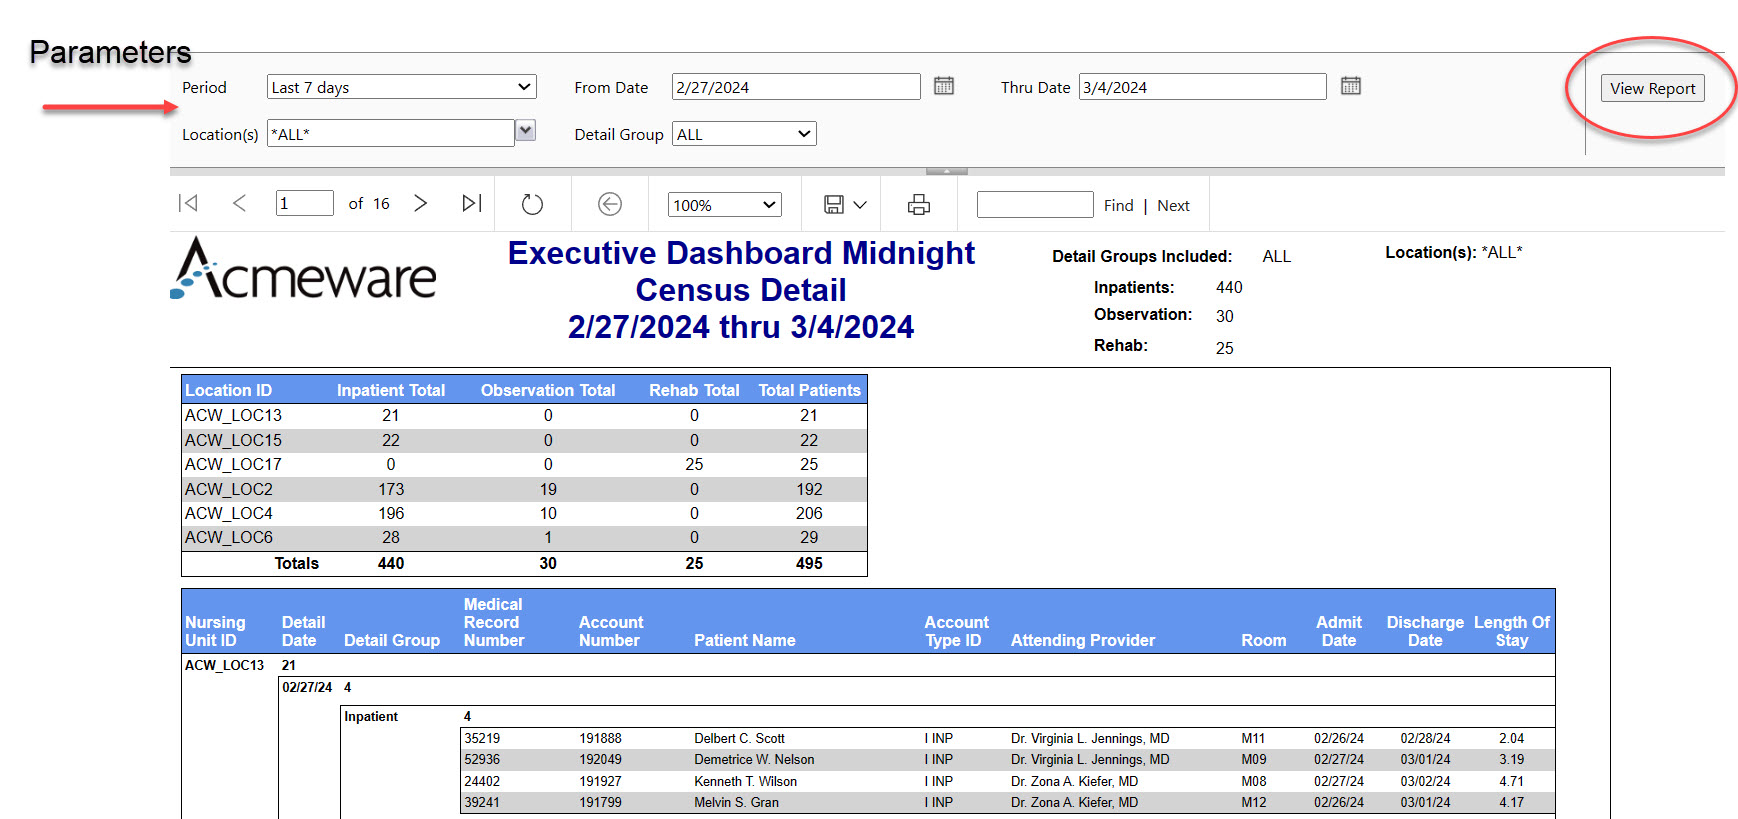
Where things start to differ between SSRS and Power BI is how the reports are executed and how we interact with them. With SSRS, If the report has parameters, you have to specify them and click “View Report, ” which in turn calls the SQL stored procedure (or embedded query expression) to produce the report dataset and the finished report. In other words, you have to wait for the process to run before it presents any data. If you subsequently change one of those parameters, the report re-executes and you have to wait at least a few seconds (sometimes longer) for the report to completely refresh. Even for reports that don’t have user-specified parameters, the report still calls the supporting SP or query when it runs. SSRS can “pre-compile” reports with scheduled snapshots or subscriptions, but in general, when you run a report, you wait for it.
A parameter-driven SSRS report
You'll never see this message in Power BI...
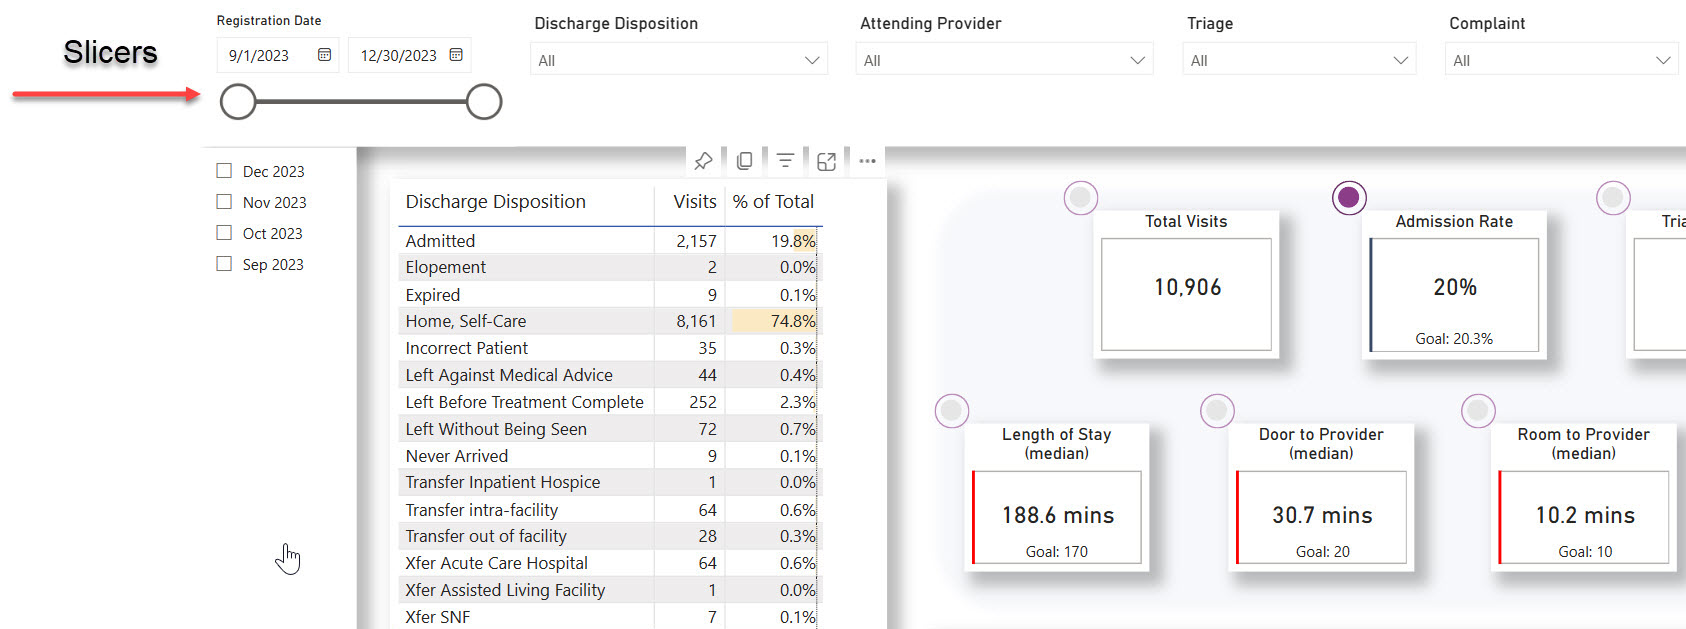
The Power BI experience is different. After selecting a report from the available list in the workspace (or App, which is a nice way to organize reports for most users), the report presents immediately. While BI doesn’t accept SQL parameters like SSRS, it uses “slicers” that allows users to pick from lists and pass values to filter the report. Filters behave like a parameter in SSRS, in that they limit the relevant data based on the value you’ve selected – all data for a specific date range, provider, or insurance, for example. When you select or change any of the slicers, the report and all its visualizations change immediately – charts are changed, matrixes updated with new totals, etc.
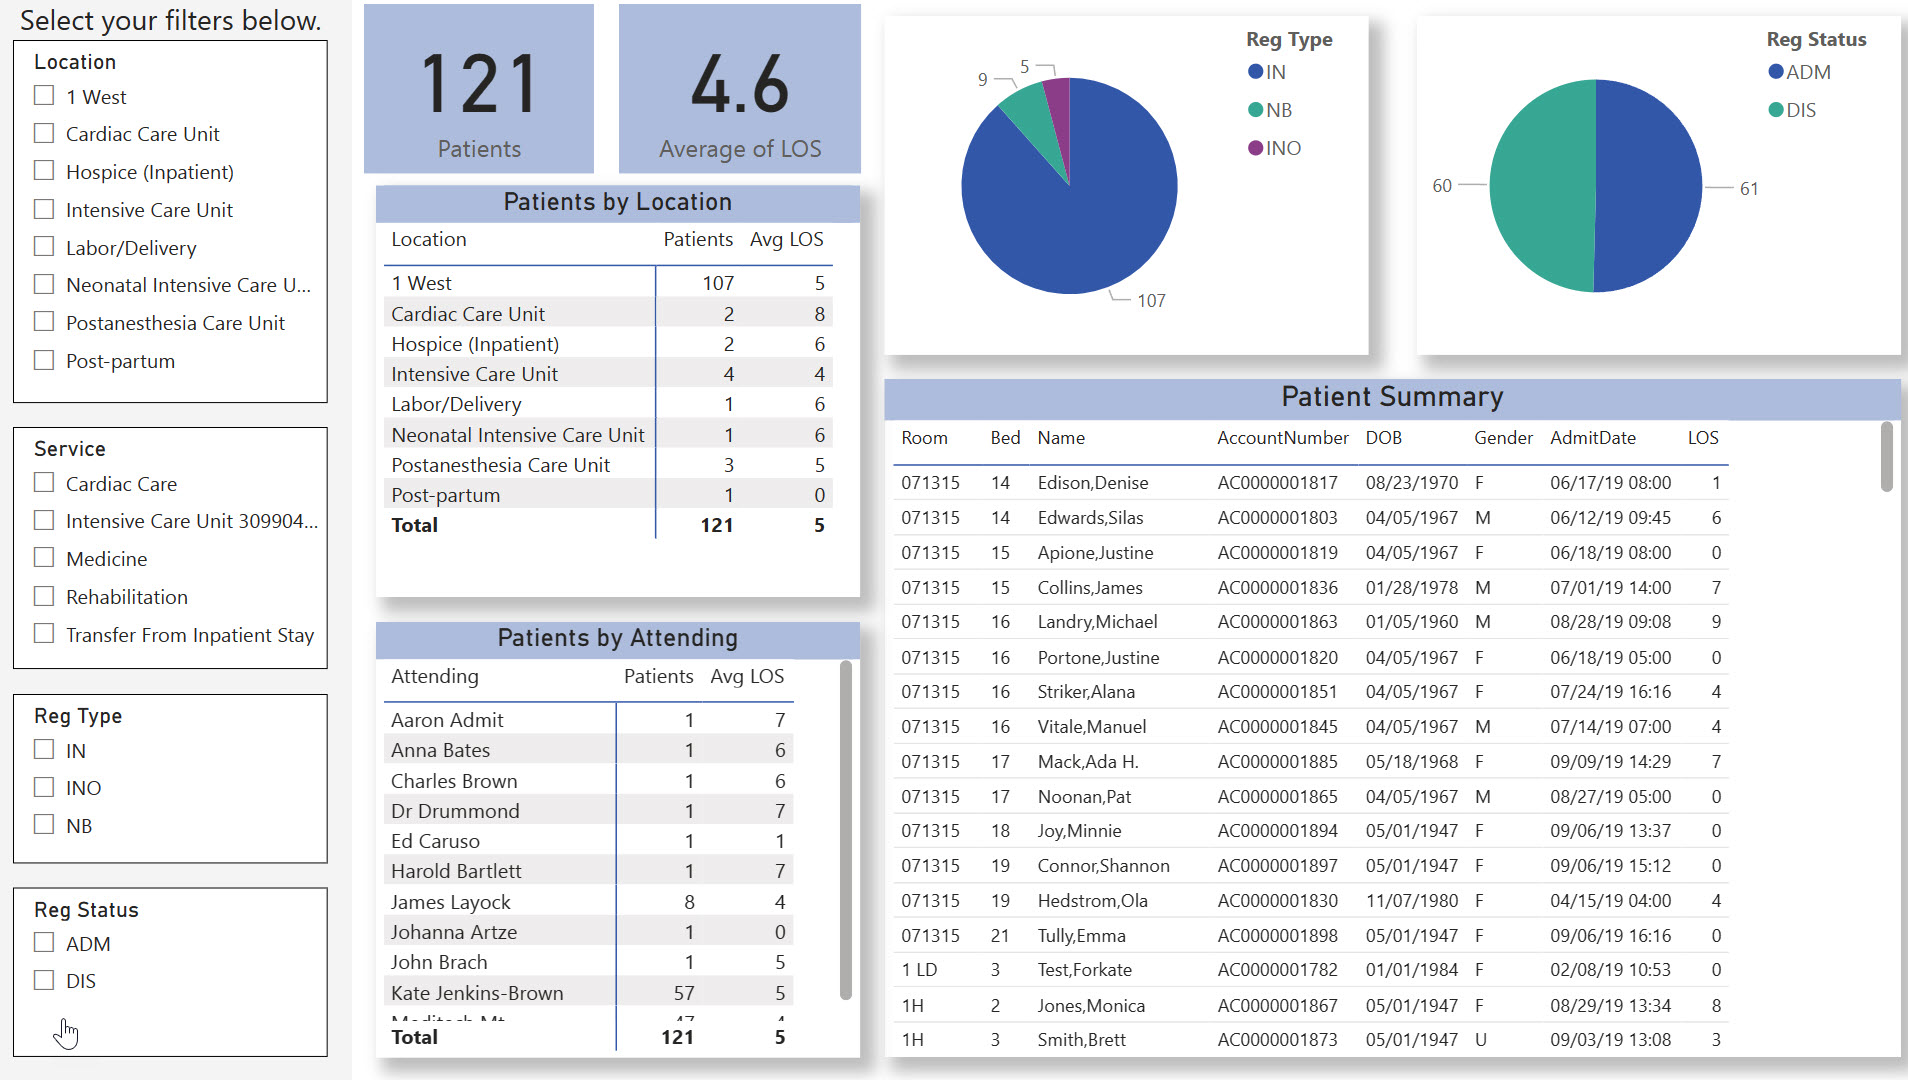
A Power BI report with slicers and dynamic visuals
This is all made possible by a fundamental difference in Power BI: by default, the report data (what in SSRS we’d call the dataset) are stored with the report itself. Power BI caches the data with the report definition (called the semantic model after it’s published to the Power BI service) so when a user interacts with the report, they immediately see how their mouse clicks and selections affect other visualizations on the report.
I used the word “visualization” there, and pardon me for assuming readers know what I mean: in Power BI, a visualization is a graphical representation of data on a report page. What comes to mind if you’re coming from SSRS would be a chart or maybe a KPI indicator, like a gauge.
A dashboard-like SSRS report. Not bad.
But in Power BI, visualizations include tables, matrices, charts, and much more – it’s any object on the page that presents data. Visualizations in Power BI are dynamic and interactive by default – that is, click a subtotal in a matrix, a slice from a pie chart, etc. and all the other related visuals on the report change to reflect what you’ve selected. Instantly. It’s this type of interactivity that truly elevates Power BI over SSRS, and in my opinion, enable true user self-service analytics. It’s much more than a simple static report.
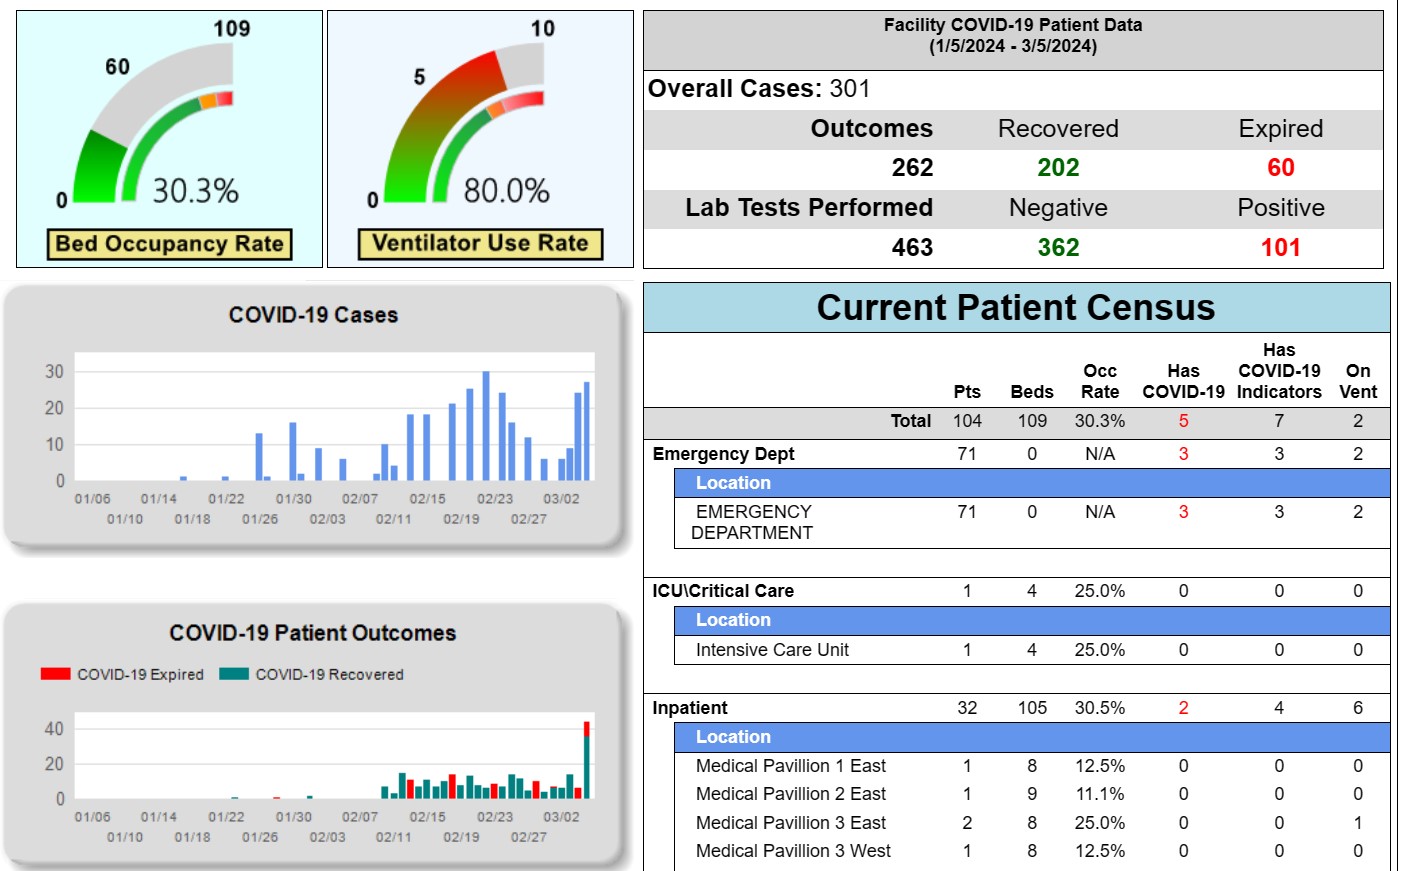
A patient census dashboard in Power BI. Users can select slicers, drill down through matrices, and more.
Beyond the report presentation and interactivity differences, Power BI has other features that elevate it beyond simple report presentation. Design elements include easy drilling up and down data hierarchies, drill-through capability (select a total balance from BAR and drill through to patient account detail, for example). Report designers can use programmable buttons on their reports to aid page navigation, provide detailed user instructions, or interact with report slicers. You can even embed Microsoft Power Apps in a visual to display data from your App or even collect data to refer back to later. Microsoft really has done a great job of providing the capability for users to have an application-like experience, not just view static reports.
Summary
I hope my last two blogs have illustrated why I'm convinced that Microsoft Power BI is the best analytics solution for Meditech hospitals. Starting with Data Repository of course, but easily incorporating data from many disparate data sources too. If you have a deep library of SQL Server Reporting Services reports already, don't be deterred: many of them can be re-designed to work well (better) with Power BI. For those that need to remain as a paginated report (tabular design, optimized for printing), those can be published in Power BI too, or co-exist in SSRS alongside Power BI. On the other hand, if you're just beginning your reporting journey with Data Repository, start with Power BI and you'll find out for yourself why it's the best reporting tool for DR.
-- Ian Proffer
Microsoft Certified Power BI Data Analyst Associate
Read more of our Power BI Advisor blogs.
See what Power BI-based solution Acmeware is offering our clients.